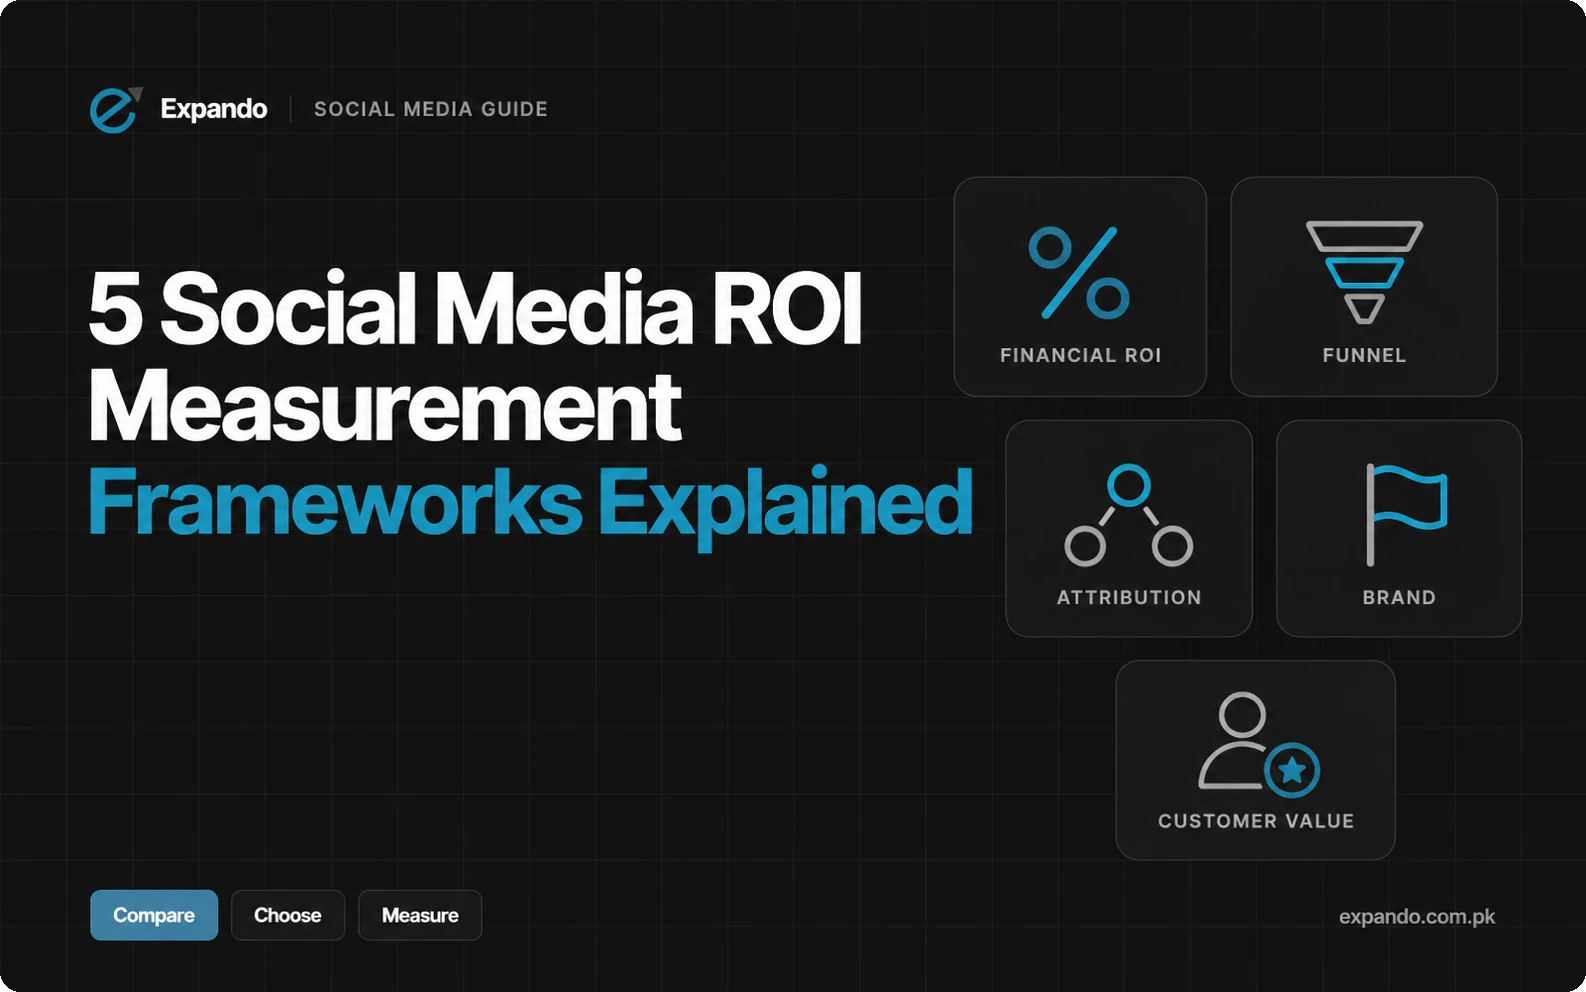
The most useful social media ROI measurement approaches are financial ROI for monetary outcomes, funnel metrics for journey bottlenecks, attribution for assigning credit, brand outcomes for awareness and perception, and lifetime value/acquisition efficiency for customer economics.
The best choice depends on your business question, data and sales cycle, and you can combine approaches. These are practical measurement categories rather than five standardized formulas: several provide supporting evidence without calculating monetary ROI.
Why is social media ROI difficult to measure?
A customer may discover your brand on social, visit later through search, speak to a salesperson and buy after the reporting month ends. Incomplete customer records and different attribution windows make those interactions difficult to connect. Paid and organic work also share content, people and tools, so the cost boundary needs to be explicit.
Agree on the decision first: are you assessing contribution, investigating lead quality or evaluating awareness? AMEC’s Integrated Evaluation Framework supports aligning objectives, baselines and targets before measuring outputs, out-takes, outcomes and impact. It is a named communications-evaluation framework, separate from the five editorial categories used here. For the baseline workflow, see Expando’s social media ROI how-to.
Compare the five social media measurement approaches
Use this comparison to choose a primary business question and identify the minimum evidence needed to answer it. Financial ROI can calculate a scoped monetary return; the other approaches explain performance, allocate credit or estimate future economics. No numerical ranking makes one universally best.
|
Approach / evidence |
Best-fit question |
Minimum data |
Useful KPIs |
Main limitation |
|
Financial ROI / monetary |
Did contribution cover social cost? |
Net sales, variable costs, social costs |
Contribution; scoped ROI; ROAS separately |
Attribution is not causation |
|
Funnel / diagnostic |
Where do prospects stop? |
Defined stages + linked lead records |
Qualified leads; progression; CPL |
Activity is not financial return |
|
Attribution / credit |
Which tracked interactions get credit? |
Campaign/event IDs, windows, linked sales |
Attributed sales; paths |
Credit depends on model/coverage |
|
Brand / nonfinancial |
Did awareness or perception change? |
Audience, baseline, survey/listening scope |
Awareness; favourability; sentiment |
No automatic cash value |
|
LTV/CAC / economics |
What is customer value versus acquisition cost? |
Matched customer cohorts, costs, horizon |
Contribution LTV; CAC; payback |
Forecast assumptions; repeat-sale credit |
The strongest report combines relevant evidence without adding unlike values together. For example, financial contribution, qualified-lead counts and awareness indicators can sit alongside each other, but they are not three separate amounts of monetary return.
The five approaches in practice
1. Financial ROI
Use financial ROI when you can connect social activity with a defined sales outcome and reliable costs. In this guide, ROI on social marketing spend (%) = (attributable contribution before social cost − total in-scope social cost) ÷ total in-scope social cost × 100. Contribution means net sales less variable product or service delivery costs, before social costs.
Include the relevant advertising, content, creator, agency, staff and tool costs, allocating shared expenses consistently. Net out refunds and cancellations. A campaign with contribution above those social costs has a positive return under this convention, but the result excludes any fixed overhead outside the scope. It is not a total-business ROI.
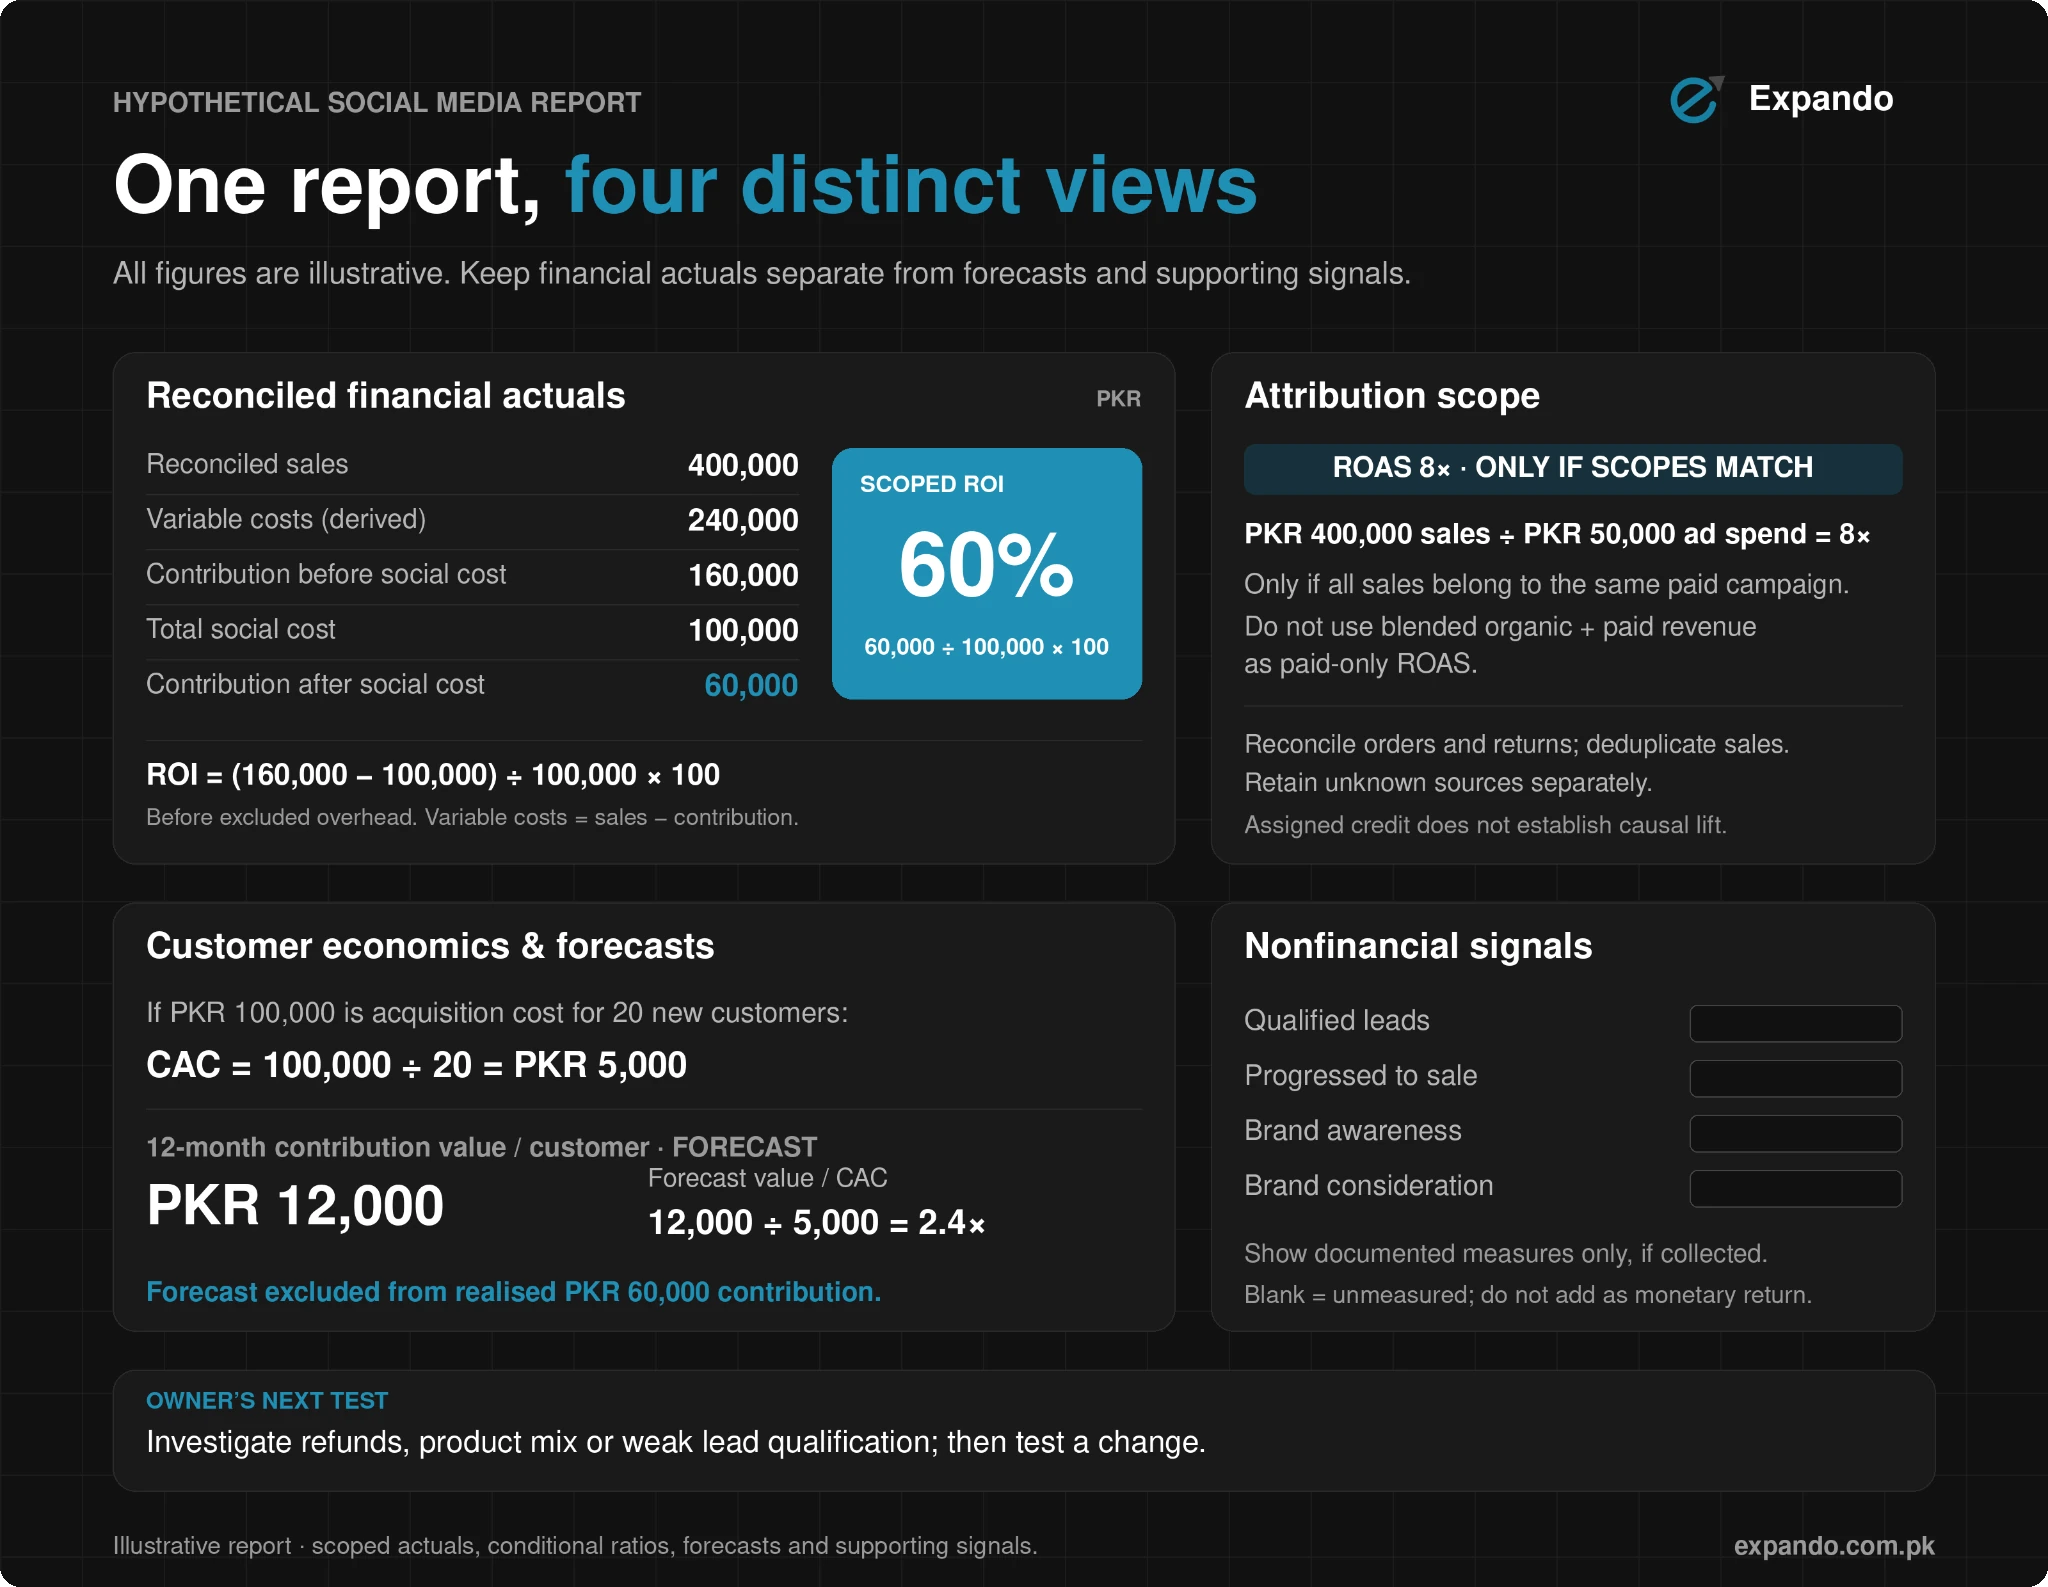
The hypothetical report below produces 60% ROI after variable delivery costs and full social cost. Revenue divided by ad spend is a different measure. ROAS, or return on advertising spend. Neither an attractive revenue multiple nor attribution alone establishes that social caused every sale.
2. Funnel metrics
Use funnel metrics to locate the stage that needs attention: exposure, engagement, enquiry, qualified lead, opportunity or customer. Define what qualifies a lead and connect stages in a CRM, a customer relationship management system or a structured register. Track stage counts, progression rates and cost per qualified lead using a stated cost basis.
For example, if enquiries remain steady but fewer meet your qualification criteria, investigate targeting, creative and the offer before simply increasing spend. If qualified leads rise but sales do not, inspect follow-up and sales maturity. These are diagnostic observations, not proof of financial return. A form submission and a paying customer should remain different outcomes.
3. Attribution
Use attribution to understand how tracked interactions receive credit along a customer path. It requires consistent campaign identifiers, event or order IDs, comparison windows and links to sales records. GA4’s current attribution documentation lists data-driven, paid-and-organic last-click and Google-paid-channels last-click models. These assign credit under their respective methods.
For example, a sale that follows a social visit and a later search visit can receive different social credit under different models. Use that comparison to understand the path and report the model used. Do not add the same order’s revenue from multiple platform reports as though it were several sales.
Attribution is not the same as a campaign-specific randomized incrementality test. When feasible, a suitably designed holdout can address whether exposure added outcomes compared with a comparable unexposed group. That requires its own design and data; selecting an attribution model does not create such an experiment.
4. Brand value and outcomes
Use brand-outcome measurement when the objective concerns awareness, perception, reputation or community. Define the audience, baseline and time window, then choose appropriately designed surveys or listening measures. Relevant indicators might include awareness or favourability within a surveyed audience, share of a defined conversation, and sentiment within the content monitored.
For example, a brand tracking awareness before and after a campaign should report the audience, survey method and sample limitations. A change may justify further investigation, but it does not automatically establish that social caused it or quantify extra profit. Listening coverage and automated sentiment classification also require checking.
AMEC distinguishes communications activity from audience responses, outcomes and impact. That helps avoid treating reach as the final result. Do not assign arbitrary cash weights to likes or add an advertising-equivalent figure to realized contribution. A proposed avoided cost is an estimate until the assumptions and actual cost change are established.
5. Lifetime value and acquisition efficiency
Use customer economics when repeat purchases or a long relationship make immediate-sales reporting incomplete. Customer acquisition cost (CAC) is matched acquisition cost divided by new customers in the defined cohort. Lifetime value (LTV), also called customer lifetime value (CLV), needs a stated horizon and a clear distinction between revenue and contribution, and between observed results and forecasts.
For example, a repeat-purchase business can compare acquisition cost with contribution generated over twelve months by the customers acquired in one period. A forecast can inform a decision before all twelve months mature, but report its assumptions and revise it as actuals arrive. Do not credit social with every repeat purchase solely because it introduced the customer.
The example below shows an illustrative 2.4× forecast contribution-value/CAC ratio. That is neither a universal target nor realized profit. Retention, payback timing and the cash needed to serve customers can matter as much as the ratio.
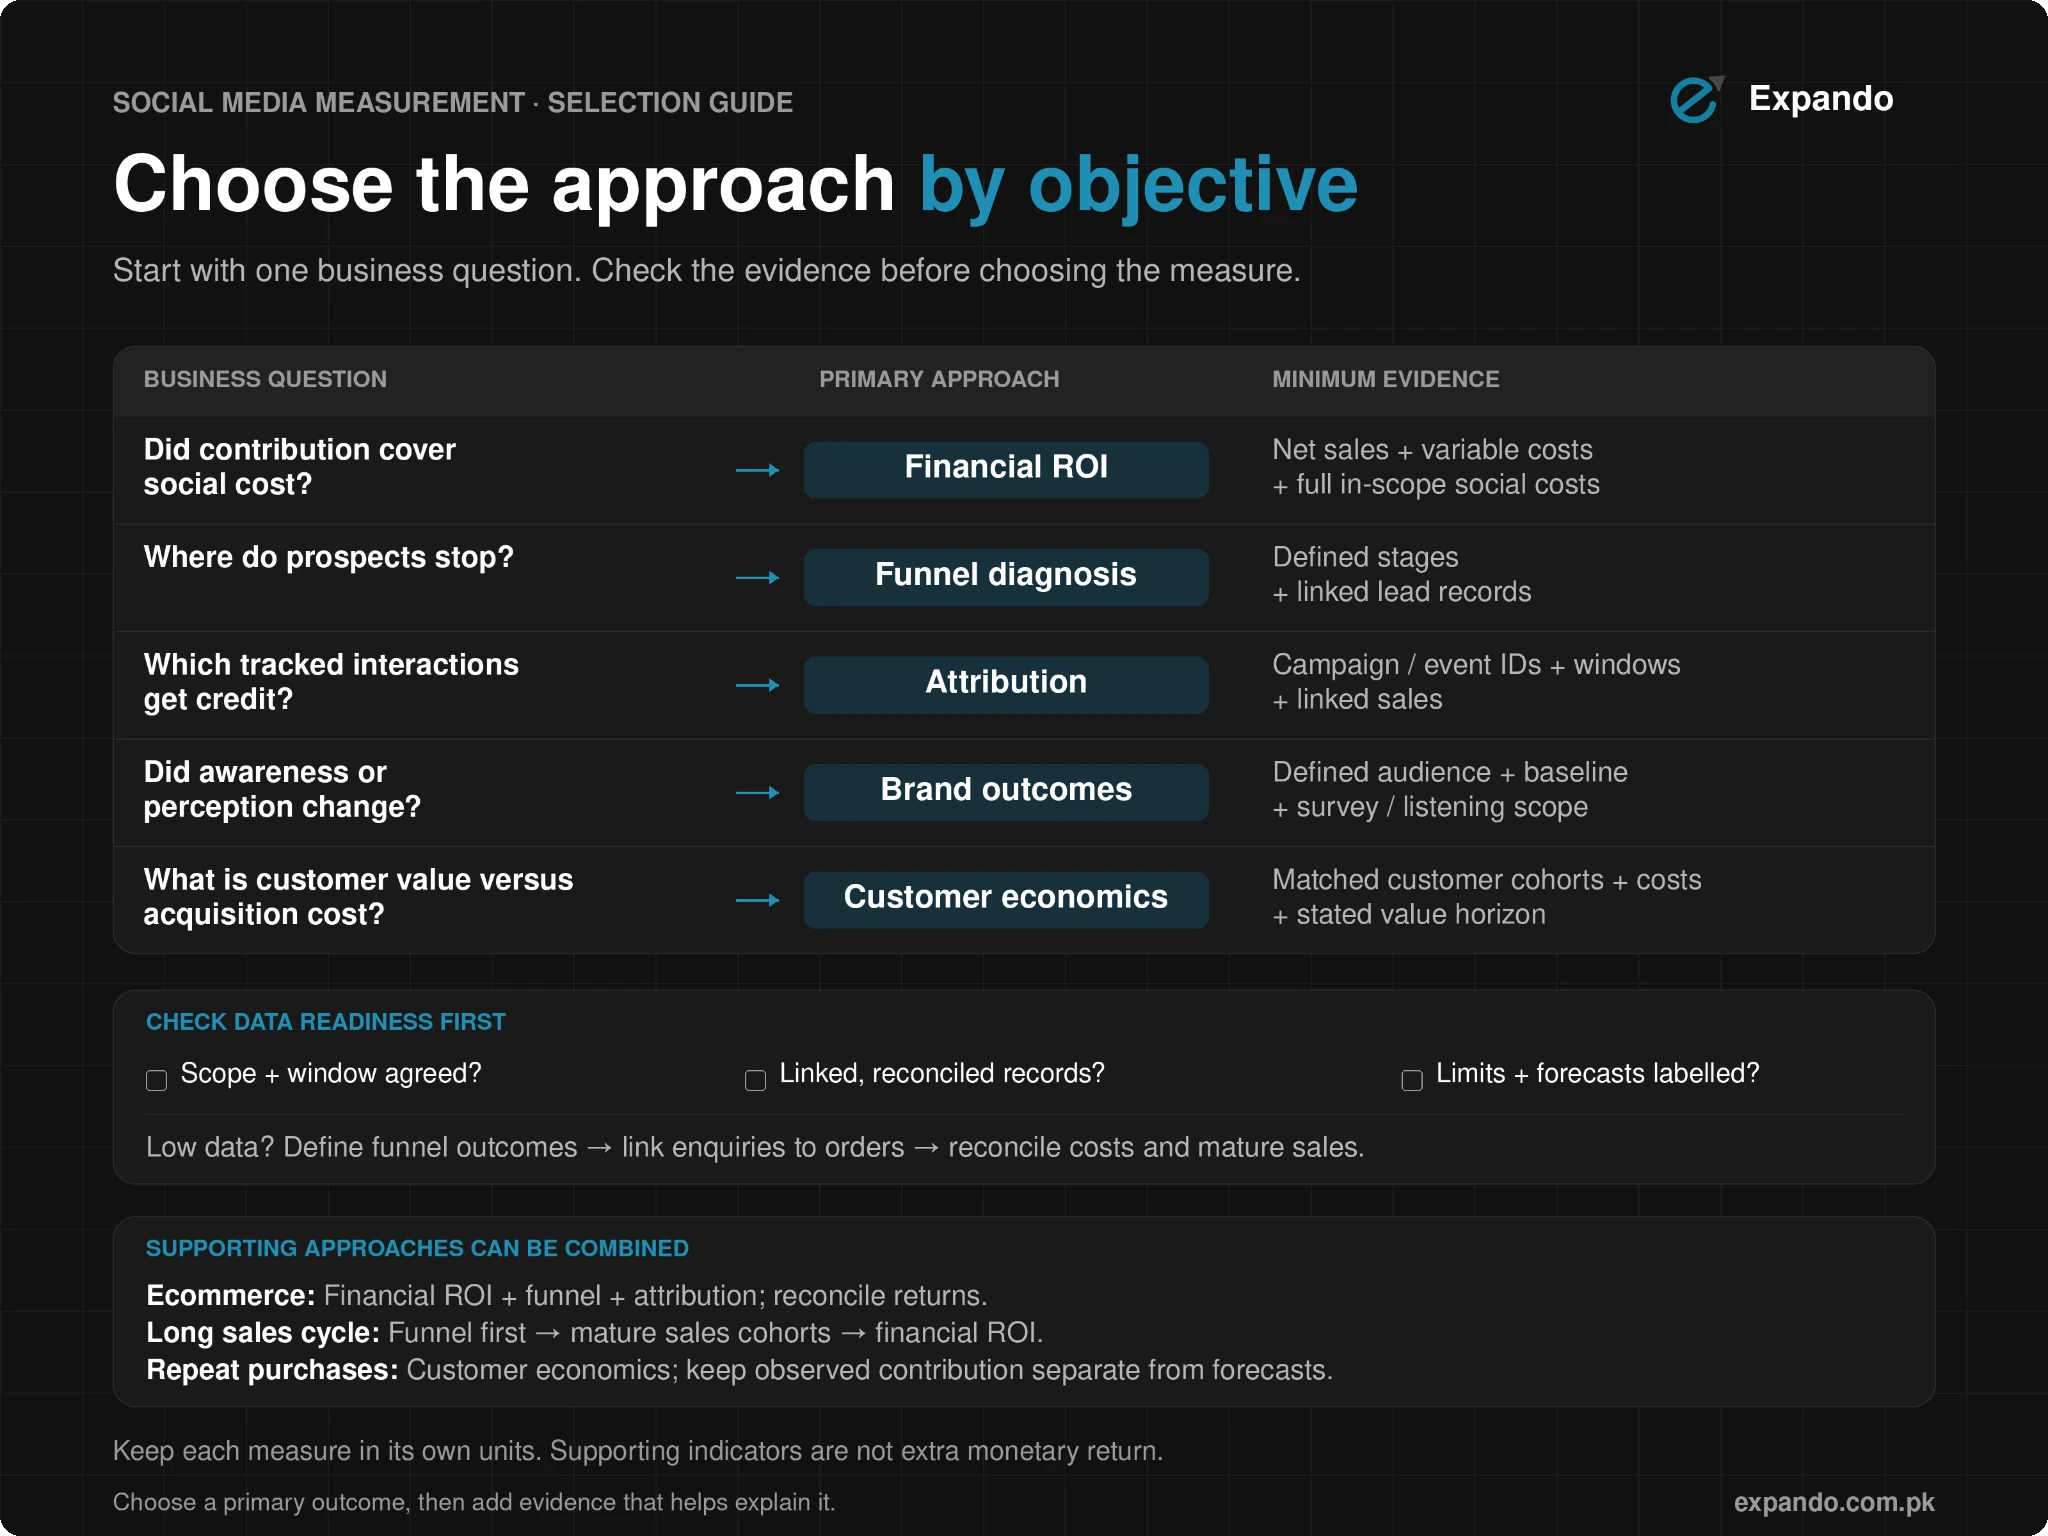
Which approach should your business choose?
Choose one primary outcome that informs the decision, then a small set of supporting measures that explain it. The table gives practical starting points; these are editorial recommendations, not formal industry rules. Paid and organic social can both serve different objectives, so choose from the actual campaign purpose.
|
Business situation |
Primary approach |
Supporting evidence / next step |
|
Ecommerce; reliable orders/costs |
Financial ROI |
Funnel + attribution; reconcile returns |
|
Service/B2B; long sales cycle |
Funnel metrics |
Track mature sales cohorts; then financial ROI |
|
Awareness or community objective |
Brand outcomes |
Define audience/baseline; inspect relevant responses |
|
Repeat-purchase business |
LTV/acquisition efficiency |
Separate observed contribution from forecasts |
|
Low-data team |
Defined funnel outcomes |
Build lead/order linkage before claiming ROI |
If data is limited, improve it in stages: standardize lead definitions, link enquiries to orders, then reconcile costs and matured outcomes. Reporting a known gap is more useful than presenting an unsupported ROI percentage. Add brand or customer-economics evidence only when it answers a distinct question.
Build a tracking and reporting process around your choice
A framework becomes useful when the team can repeat the calculation and explain its limitations. Keep one agreed report with definitions, sources and an owner rather than letting each dashboard define success differently.
- Define the objective, cohort and window. State the paid/organic scope, business question and sales recognition basis. Allow time for the sales cycle and returns; identify whether you are reporting an acquisition cohort or all outcomes occurring in a calendar period.
- Define the metrics and baseline. Record the unit, stage criteria and source for each KPI, or key performance indicator. Specify what counts as a valid enquiry, qualified lead, new customer and completed order. Set targets from the business objective rather than importing a generic benchmark.
- Connect activity to outcomes. Use consistent external campaign tracking and meaningful website events. Platform analytics show activity on the platform; GA4 helps examine tracked website interactions and paths. CRM and order records establish lead stages and sales outcomes. Surveys or listening sources support the brand question.
- Reconcile records and costs. Match enquiry/order IDs where feasible and deduplicate overlapping channel credit. For WhatsApp or phone enquiries, record the resulting lead and order in the register; for COD, reconcile delivered/paid outcomes and returns under the accounting basis chosen. Allocate shared people, content and tool costs once.
- Report the evidence and next action. Separate realized financial results, attributed credit, forecast customer value and nonfinancial indicators. Name unresolved gaps and the person responsible for checking them. A spreadsheet or BI report can organize the evidence, but software cannot make incomplete data financially conclusive.
Use a consistent review date and retain earlier assumptions so changes remain explainable. If the chosen model or metric definition changes, mark the break in comparability before interpreting a trend.
Example: what one social media report should show
This hypothetical ecommerce scenario is not an Expando client result or a Pakistan benchmark. Assume the same defined campaign cohort and period produces PKR 400,000 net attributed sales after discounts, refunds and cancellations, with PKR 240,000 variable non-marketing costs. The total PKR 100,000 social cost consists of PKR 50,000 ads and PKR 50,000 creative, people and tools.
|
Hypothetical report item |
Value |
Evidence label |
|
Net attributed sales |
PKR 400,000 |
Reconciled actual; attribution scope stated |
|
Variable non-marketing costs |
PKR 240,000 |
Matched product/delivery costs |
|
Contribution before social cost |
PKR 160,000 |
Net sales minus variable costs |
|
Total in-scope social cost |
PKR 100,000 |
50,000 ads + 50,000 other social costs |
|
Contribution after social cost |
PKR 60,000 |
Before excluded overhead |
|
ROI on social marketing spend |
60% |
Attributed financial return; not causal proof |
The scoped ROI is (PKR 160,000 − PKR 100,000) ÷ PKR 100,000 × 100 = 60%. That leaves PKR 60,000 contribution after social cost and before excluded overhead. If all PKR 400,000 sales belong to the same paid-campaign scope, ROAS is 400,000 ÷ 50,000 = 8×; blended organic and paid revenue must not be used as paid-only ROAS without matching the scope.
If all PKR 100,000 is the relevant acquisition cost for 20 new customers, CAC is PKR 5,000. A hypothetical contribution-based twelve-month customer value forecast of PKR 12,000 then gives 12,000 ÷ 5,000 = 2.4×. Label that future value as forecast and keep it separate from the realized PKR 60,000 contribution after social cost.
Alongside the financial rows, the report could show actual qualified-lead progression and documented brand indicators, if collected. Do not add those signals as extra monetary return. The owner might investigate whether refunds, the product mix or weak lead qualification explain the gap between a high ROAS and the contribution left after costs, then test a change.
Common mistakes when choosing a framework
Confusing engagement with profit: likes and reach can describe activity, but financial return needs a defensible sales and cost basis. Calling revenue contribution: deduct variable product/service costs first. Calling attribution causation: name the credit model and its limits.
Mixing forecasts with actuals: label estimated LTV and pipeline value and do not count them again when sales close. Omitting costs or changing windows: include the relevant people, creative and tools and match the outcome period. Duplicating channel credit: reconcile unique orders. Pricing awareness arbitrarily: keep survey and listening indicators in their proper units instead of creating cash values to make the report look profitable.
When the social cost denominator is zero, mark the ROI ratio not applicable. When a cost or outcome is missing, disclose it and fix the record rather than silently treating it as zero.
Choose a business question before choosing a dashboard
Start with the decision you need to make, select a primary approach and verify the data before moving the budget. Request a free social media performance review from Expando to discuss your measurement goals, or explore its Social Media Management service for strategy, content and community-management support.
Social Media ROI Measure Karne Ke 5 Frameworks
Choose a social media measurement approach according to the business question and available data. Use financial ROI for contribution after social costs, funnel metrics for customer-journey bottlenecks, attribution for credit allocation, brand outcomes for awareness and perception, and customer value versus acquisition cost for longer-term economics. Combine relevant approaches while keeping realized financial results, forecasts and nonfinancial indicators clearly labelled.
Frequently asked questions
How do I report organic social when sales are not directly trackable?
Report the objective, full allocated cost and the strongest observable outcomes, such as qualified enquiries or audience responses, with their source and limitations. Keep the financial ROI field unproven until you can connect a credible value basis to outcomes. Improve campaign tagging and enquiry-to-sale records without assuming every later sale came from organic social.
Can I use the same measurement framework for paid and organic social media?
Yes, when both support the same business objective, but define their costs and outcomes separately before combining them. Allocate shared content, staff and tools consistently, and use only matched paid-attributed sales when calculating paid ROAS. A blended social ROI report should state exactly which paid and organic activity it includes.
Can likes and engagement prove social media ROI?
Likes, comments and shares can help assess audience response, but they do not establish monetary return on their own. To calculate financial ROI, connect a defensible contribution value to business outcomes and deduct the full in-scope social cost. Keep engagement in its original units rather than assigning an arbitrary cash value. AMEC measurement guidance.
How often should I review social media ROI?
Set the review schedule around the decision and sales cycle. A practical starting point is a monthly operational review, with financial conclusions revisited after the relevant sales and return periods mature. Keep the same cohort, cost scope and definitions when comparing results, and label incomplete periods as provisional.